Plotter.js
A JavaScript helper to plot data.
Overview
This article gives an overview over the Plotter.js library.
The goal of Plotter.js is to able to draw diagrams easily. Diagrams are always drawn to HTML <canvas>-elements. Every diagram is bound to one canvas.
Diagrams
The data of diagrams is stored in points, which have a x and a y coordinate, and is grouped in point lists. Only whole point lists can be drawn on a diagram. There are currently two types of diagrams:
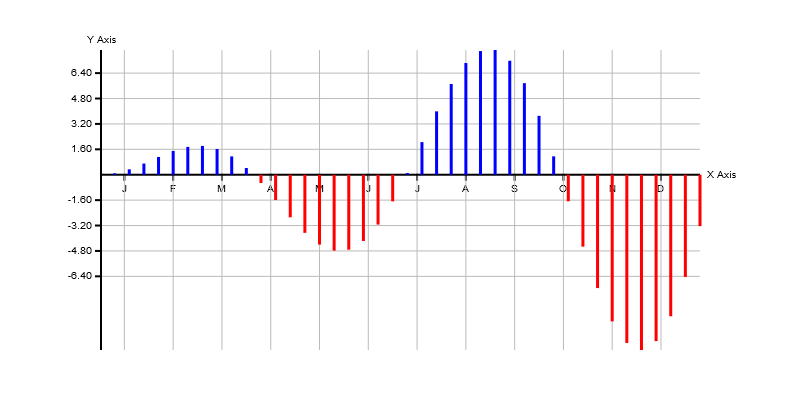
Bar charts
The points are presented as bars.
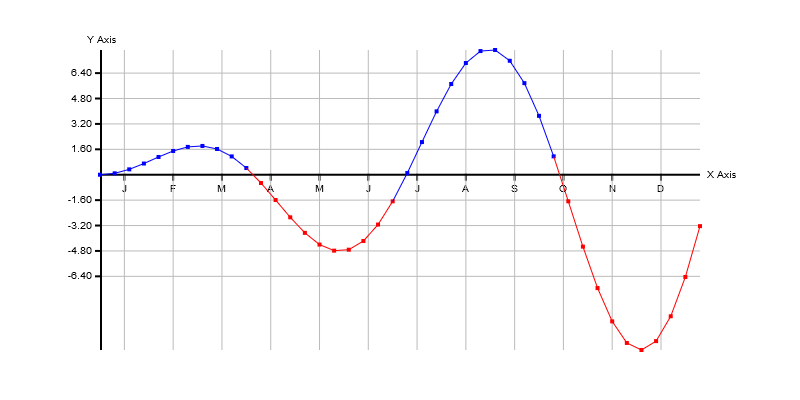
Line charts
The points are presented as single points and can be connected with a line.
API structure
All of the API components live in the global Plotter namespace. For example, to create a new instance of the Point class, you have to use
const point = new Plotter.Point()
Object hierarchy
The following diagram shows how the classes in Plotter.js are related to each other.
Object
├── PointList
╰── ImageComponent
    ├── Point
    ╰── DataConsumer
        ├── Axis
        ╰── CanvasImage
            ╰── Diagram